Find out which basin is worth a call before you make it.
A yearly screen of your reservoirs, quarry lakes and settling ponds for surface area, level stability, shading and shoreline access, ranked as floating-PV candidates.
- Legend
- Surface area
- Shading zone
- Shoreline access
01The job today
How the long list gets cut down today
You have a target for floating solar and a list of water bodies that could carry it: public reservoirs, irrigation ponds, a few quarry lakes the land agent has mentioned, some settling ponds at industrial sites. Before anyone picks up the phone to an owner, somebody on your team has to say which of them are worth the call.
That somebody is usually a development analyst with a browser and a spreadsheet. For each water body they hunt for level records, if the owner publishes any, which a quarry or a private pond rarely does. They open the shoreline in a web map and hope the imagery is from a year that means something. They squint at tree lines and try to guess where the afternoon shadow falls. They look for a road that gets to the bank. Then they write one line in the screening sheet and move to the next.
It works, slowly, and it breaks in two places. The first is a site that looks fine on paper and draws down hard every dry season, which you learn after the owner has taken your call and the bathymetric survey is being scoped. The second is the site where the only track runs along the far bank. If you sit on the utility side, you get the mirror image: developers ask whether your reservoirs could host panels, and you have no ranked view of your own portfolio to answer with.
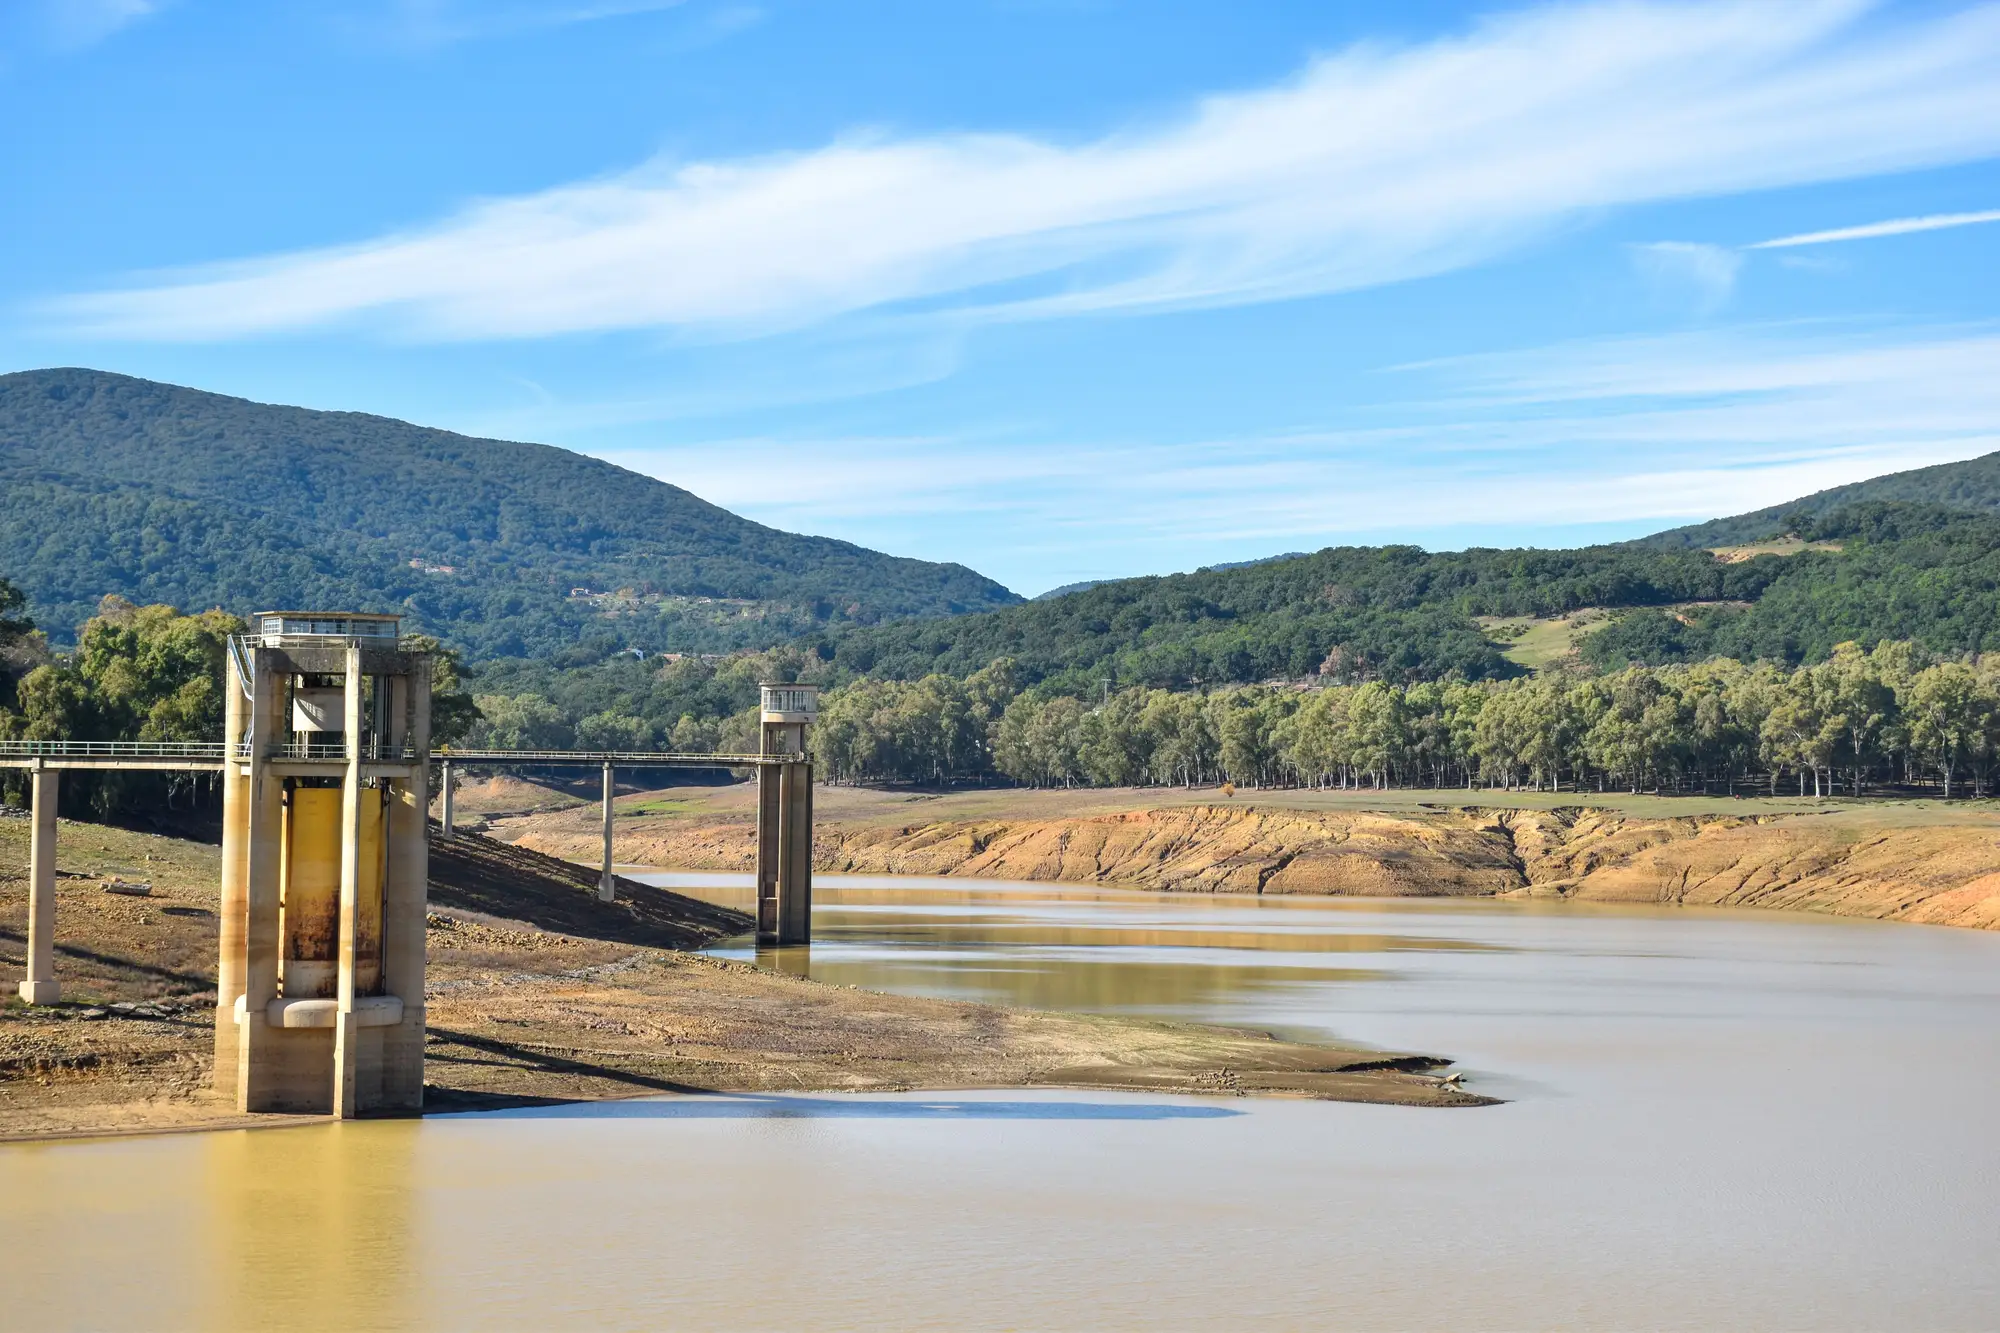
What changes here is the order of work. The screen reads every water body on your list from the same imagery, once a year, and hands back a ranking, so the calls and the surveys go to the top of it.
02
Where the screen sits
The screen comes before the bathymetric survey and the mooring design, and before anyone asks about permitting or interconnection. It narrows a portfolio of water bodies to the ones worth commissioning a technical study on. It does not replace that study.
03What you get
What comes back for your water bodies
This is an early-access offer, shaped with the first teams who use it. Scope, region and format are agreed with you before any imagery is read.
3.1
Candidate rankingCSV and map layer
Your water bodies ordered by the four criteria, one row per water body, with the reading behind each criterion alongside it so you can re-sort for what matters to you. It opens in your screening spreadsheet or in QGIS or ArcGIS.
3.2
Surface-area readGeoPackage
The measured open-water extent of each water body, tracked across the available imagery history, with the date of each image used. Where the edge has moved, you see the outlines side by side.
3.3
Shading mapGeoPackage
Tree-line and terrain shadow zones on and around each water body, so you can see which parts of the surface sit in shade and which are open.
3.4
Shoreline access readpoint and line layer
Where a road, track or open bank reaches the water, marked per water body, so the land agent and the cable route planner start from the same picture.
04
How it works
Send the list
The reservoirs or region you want screened, as a list of water bodies, a shapefile or just a region. If the owner gives you operating levels for some of them, send those too.
Annual pass
The water bodies are read from high-resolution multispectral satellite imagery, once for the year.
Screen
Surface area is measured, the shoreline is compared across the imagery record to see how far the water's edge moves, shadow zones are mapped, and access to the bank is read.
Rank
You get the ranked candidate list per water body, with the maps behind it. Next year's pass adds to the same list.
05
Limits
These are the ways a screen like this can mislead you. Read them before you rank anything.
L1
Not an engineering study
It says nothing about mooring, anchoring, wind loads or depth. Those need a bathymetric survey and a design study on the shortlist.
L2
Level stability is read from the shoreline
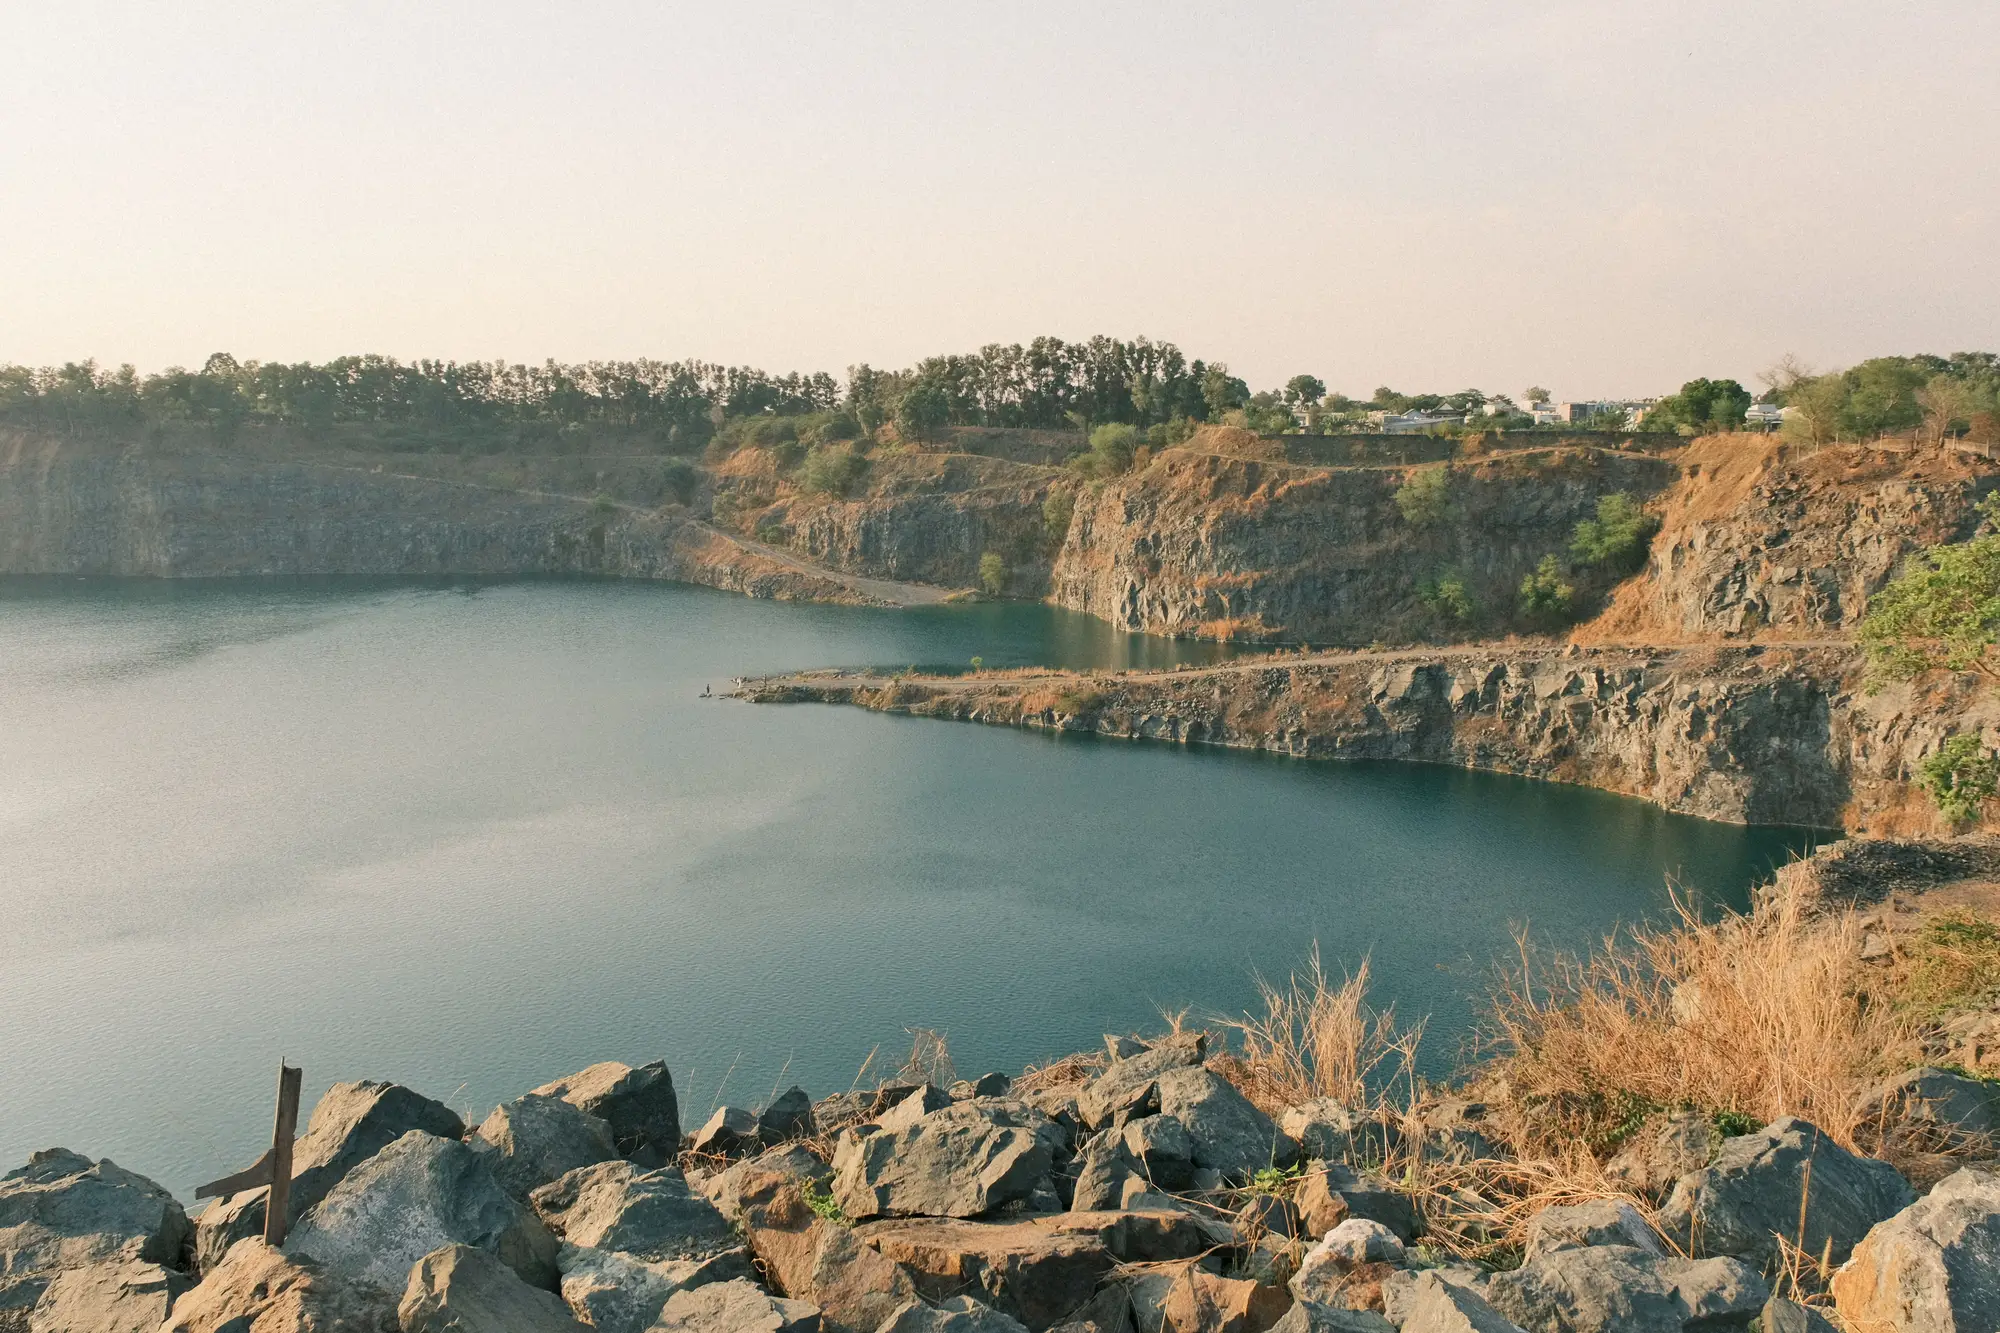
Stability is judged from how much the water's edge moves across the imagery record, not from gauge readings. On a steep-sided quarry lake the level can change a lot while the edge in plan view barely moves, and the screen will read that as stable. Where you have operating levels, use them to check the top of the ranking.
L3
Not a permit signal
A high rank is not a permit and not an approval. Permitting, site control and interconnection are separate processes with their own owners.
L4
0.5–2 m is the floor
A narrow farm track, a fence line or a thin strip of trees can fall below what the imagery resolves. Small ponds have few pixels across them, and detection gets less reliable the smaller the pond. Send us your smallest candidates and we will tell you which ones the screen can read.
L5
Annual cadence
One pass per region per year. It shows the year's picture, not a seasonal swing, so a drawdown that comes and goes between passes can be missed.
L6
Imagery history varies
How far back the level record can look depends on how much usable imagery exists for each water body, and cloud decides which dates are available.
06
Who it's for
- Project development managers at solar developers who need to cut a long list of water bodies to a shortlist worth an owner call.
- Asset planners at water utilities who want a ranked view of their own reservoirs before a developer asks.
- Development analysts and GIS analysts who keep the site list and want candidate layers they can open.
Who it's not for
- Teams that need mooring, anchoring or structural feasibility. That takes a bathymetric survey and an engineering study.
- Teams looking for a permit or approval indicator.
- A single pond on one landowner's property that someone can simply walk. The value here is a ranking across many water bodies.
- Forecasts of yield or revenue for a specific array.
07FAQ
Questions from developers and utilities
Does this confirm that a site can take a floating array?
No. It is a screen of surface area, level stability, shading and shoreline access. The structural and mooring questions belong to the survey and design work that follows on the shortlist.
How do you judge level stability without gauge records?
From the imagery. The water's edge is outlined on each available image and compared, so a reservoir whose shoreline moves a long way between dates ranks lower than one that sits still. It is a proxy, and it is weakest where the banks are steep.
How current is an annual screen?
One pass per region per year. If you need a pass at a particular time of year, say so when you ask for early access.
Will it cover small ponds?
Down to a point. Below a certain surface area the outline and the edge movement become unreliable at this resolution. Flag your smallest candidates and they get checked before anyone promises coverage.
Does a top rank mean we can get a permit?
No. Permitting is a separate process, and so are the owner's consent and the grid connection.
Can we check the ranking against our own data?
Yes. Every reading carries its image date, so you can set it against the operating levels the utility publishes, your own site visits or an earlier survey, and see where the screen agrees and where it does not.
Do we own what you deliver?
Ownership and use terms for the delivered layers are written into the contract before work starts. The imagery the maps are read from stays under its provider's licence.
How is it priced?
Each screen is scoped and quoted on its own, from the number of water bodies and the region. You get a written scope you can take through procurement.