How to estimate evaporation savings from floating solar on a reservoir
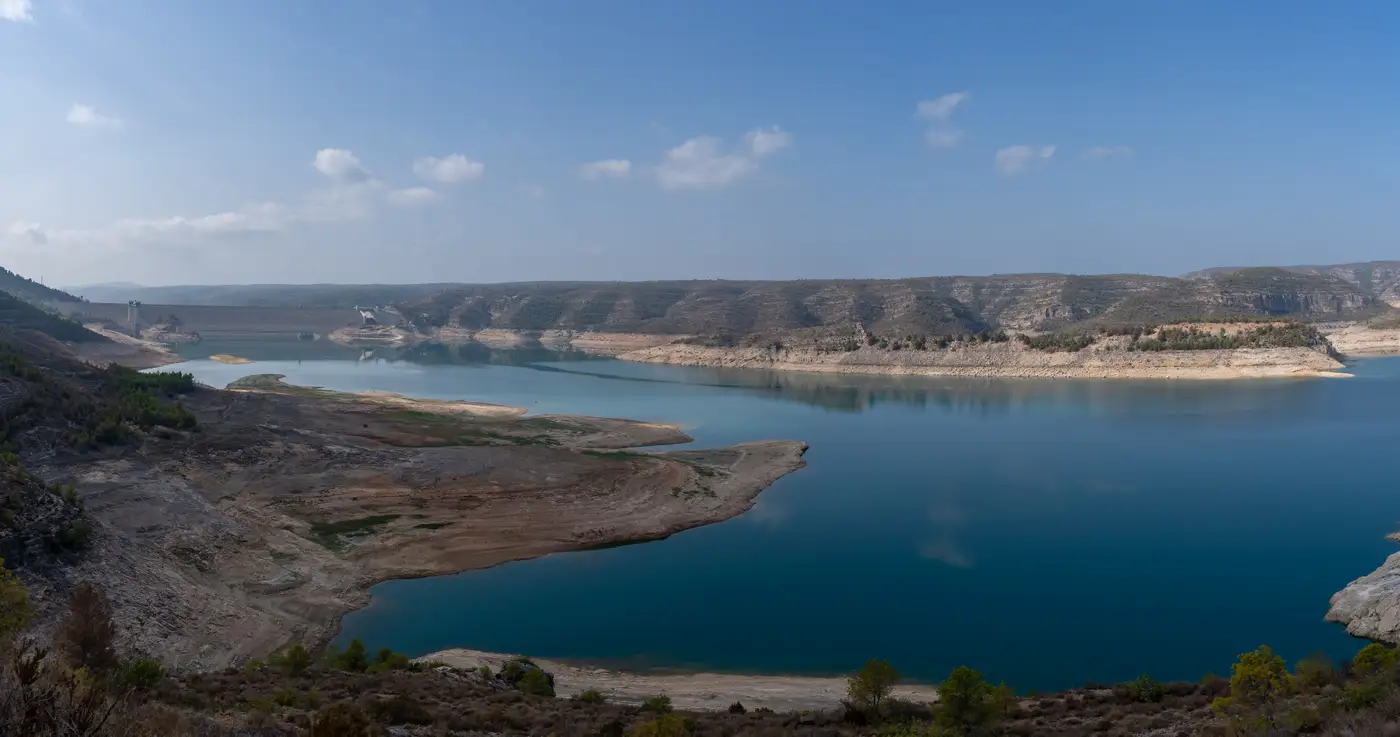
Every water utility that puts floating PV on the table eventually gets the same question from a board member or a drought task force: how much water does this save. It's a fair question, and it's answerable with data most utilities already have sitting in a filing cabinet or a state climate office database. You don't need a hydrology consultant on retainer to get a defensible first number.
Start with the reservoir's baseline evaporation rate
Before you can estimate savings, you need to know what the reservoir loses today without any panels on it. The standard starting point is free water surface evaporation, which most state ag extension offices and the National Weather Service publish as pan evaporation data adjusted by a pan coefficient (usually around 0.7 to 0.8, depending on your region's wind and humidity). If your reservoir already has an on-site evaporation pan or a nearby climate station, use that record directly rather than pulling a regional average. Subtract average precipitation for the same period to get net evaporative loss, since that's the number that shows up in your water budget.
Multiply that annual net evaporation rate (usually expressed in inches or millimeters per year) by your reservoir's surface area, and you get a baseline volume lost to evaporation in acre-feet or cubic meters. This is the number everything else gets measured against.
Apply a coverage-based reduction factor
Floating panels reduce evaporation two ways: they block solar radiation from heating the water surface directly beneath them, and they reduce wind-driven mixing at the surface. Published field studies on floating PV installations consistently find that the reduction scales with how much of the surface is covered, not with system wattage or panel brand. A reservoir with 10% coverage sees a modest reduction. A reservoir with 40% or 50% coverage sees a much larger one, though the relationship isn't perfectly linear because wind sheltering effects extend somewhat past the panel edges.
The practical approach: take your planned coverage percentage, apply it against your baseline evaporation volume, and treat the result as a rough estimate rather than a guaranteed figure. Site-specific factors matter more than people expect. Shallow reservoirs with a lot of edge-to-area ratio behave differently than deep, compact ones. Reservoirs in windy corridors see more benefit from wind suppression than calm ones. If you're building this estimate for a board presentation or a grant application, note the assumptions behind your coverage number right alongside the result, so nobody mistakes a screening estimate for a measured outcome.
Seasonal timing also matters for how the savings get reported. A reservoir that loses most of its annual evaporation during three hot summer months will show a different savings profile than one with flatter year-round loss, even if the annual totals look similar on paper.
Why surface area and shoreline access decide feasibility first
None of this evaporation math is worth running until you know the reservoir is a candidate for floating PV in the first place. Surface area has to be large enough to justify the anchoring and electrical infrastructure. Water level has to stay reasonably stable across seasons, because a reservoir that draws down 20 feet in a dry year leaves panels stranded on mudflats or anchor lines over-extended. Shoreline access has to support getting equipment and cable runs in. And shading from trees or terrain along the bank can cut into the output you're counting on to make the evaporation case alongside the generation case.
Most teams find out which of their reservoirs clear those first screens by pulling water-level records and shoreline maps one at a time, reservoir by reservoir, which is slow when you're ranking a portfolio of a dozen or more sites. Floating Solar Screening builds a candidate map across your whole portfolio from satellite imagery, scoring each water body on surface area, level stability, shading and shoreline access, so you know which reservoirs are worth running the evaporation and generation numbers on before you spend staff time on site visits.
If evaporation savings are part of the business case you're building, start by seeing which of your reservoirs rank as real candidates.